Intra-seasonal variability of weather patterns is of great significance for the occurrence and evolution of air pollution and the forecast of future air quality. Previous studies have focused on haze episodes from the perspective of weather processes and local meteorological conditions, but little is known about the influence of intra-seasonal variability of weather circulation on the occurrence and evolution of air pollution. Winter is the season when air pollution frequently occurs, so we particularly need to pay more attention to the impact of intra-seasonal weather variability on air quality during the season.
Recently, Dr. ZHAO Shuyu from the Institute of Earth Environment (IEE), Chinese Academy of Sciences, examined the impact of the intra-seasonal variability of mid-tropospheric westerly circulation and surface Siberian High on air quality during the 2015-2016 winter, using ECMWF ERA-interim reanalysis data, ambient PM2.5 mass concentrations monitored by the Chinese Ministry of Ecology and Environment and a coupled online WRF-CHEM model.
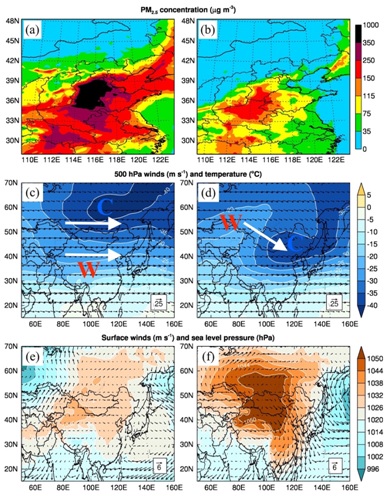
Research found that a wavy westerly circulation at 500 hPa corresponded to a strengthened surface Siberian High, causing much southward cold fresh air advection and low PM2.5 concentrations in eastern China. While a straight westerly circulation prevailed at 500 hPa, there was a weaker surface Siberian High, confining cold air within high latitudes and isolating warm air at the mid-latitudes, and causing higher PM2.5 concentrations in eastern China. Difference in the westerly circulation significantly induced change in PM2.5 concentrations over eastern China, the maximal change exceeding 200μg·m-3 by simulating two extreme weather patterns.
These findings illustrate that understanding the intra-seasonal variability of weather patterns mechanically is greatly important to improve short-term air quality forecast and warning, and have investigated how intra-seasonal variability of weather patterns affect wintertime air pollution in China. In the future, short-term climate prediction could apply to air pollution mitigation and prevention in operational forecast.
This work was published in Journal of Geophysical Research – Atmospheres.

Spatial distributions of surface PM2.5 concentrations on the heavily polluted days (a) and clean days (b) under two extremely different weather patterns. (c) and (d) for winds (the arrows, m·s-1) and temperature (the shading with borders, °C) at 500 hPa. (e) and (f) for winds (the arrows, m·s-1) and sea level pressure (the shading with borders, hPa) at the surface. Panel (c) exhibits strong straight westerly winds and isolated warm and cold air masses at 500 hPa, corresponding to (e) a weak surface SiH and weak northerly winds. Panel (d) exhibits enhanced north-south oriented airflows and southward cold air masses at 500 hPa, corresponding to (f) a strong surface SiH and strong northerly winds. The white arrows in panels (c) and (d) represent the airflow motions, and “W” represents the warm core and “C” represents the cold core. (Image by ZHAO Shuyu et. al)
Contact: Contact: Bai Jie, Institute of Earth Environment, Chinese Academy of Sciences, Xi'an, China. Email: baijie@ieecas.cn
 © 2015 Institute of Earth Environment,CAS
 Address:No. 97 Yanxiang Road, Xi'an 710061, Shaanxi, China

 Location :