Evaluating the influence of climatic fluctuation on human society is a focal point in the context of “Global Change Research Program” that is currently carried out all over the world. Quantifying climatic variability for the last few millennia is of great significance not only for understanding decadal- to centennial-scale climatic evolution in the past, but also for anticipating periodic climatic dynamic in the future. China has one of the longest recorded histories of any human civilization in the world. A rich source of long-term historical documents together with many high-resolution geological achieves such as tree rings, ice cores, stalagmites and lake sediment cores in China, provide abundant research materials to be used for reconstructing the climatic variations during Chinese historical times from the Han to Qing Dynasty. Combining both historical documents and palaeoclimatic proxy records is a robust approach to investigate the past relationships between climatic change and social development in historical China.
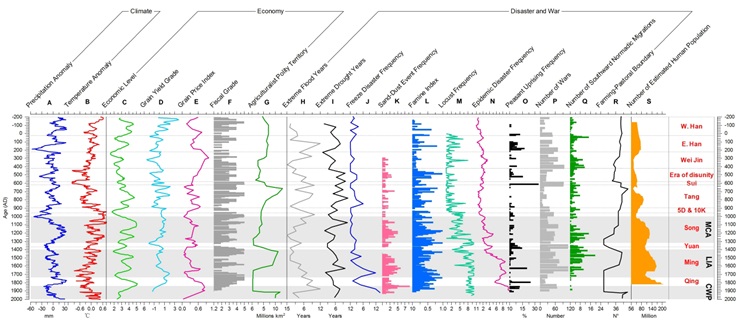
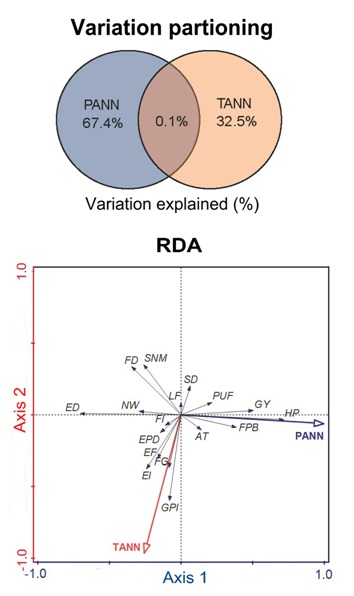
A recently-published article by LI Jianyong, DODSON John, YAN Hong from the State Key Laboratory of Loess and Quaternary Geology, Institute of Earth Environment, Chinese Academy of Sciences, as well as other co-authors, has applied a set of fossil pollen data and a coupled climate model to numerically infer the detailed variations in annual mean precipitation (PANN) and annual mean temperature (TANN) for the northern part of monsoonal China (NC) during the last 2200 years. This study has also assembled a Chinese historical dataset consisting of 17 fine-grained, numerical agro-ecological, social-economic, and geo-political records during the period of China's history. The pollen-based estimates for precipitation and temperature anomalies on centennial- to millennial-scale can be likely considered as a representative for the entire NC by comparison with other related climatic records (Fig.1). Statistical analyses such as variation partitioning and redundancy analysis (RDA) were utilized to quantify the independent effects of climatic factors on accounting for the total variation of 17 numerical Chinese historical records. For the first time, to the best of our knowledge, precipitation (67.4%) has been demonstrated to be more important than temperature (32.5%) in causing the overall agro-ecological and macro-geopolitical shifts in imperial China with NC as the central ruling region and an agricultural heartland over the last 2200 years (Fig.2).
This study has been recently published by a well-known international journal “Quaternary Science Reviews” (Li, J.Y., Dodson, J., Hong, Y., et al., 2017, Quantifying climatic variability in monsoonal northern China over the last 2200 years and its role in driving Chinese dynastic changes, Quaternary Science Reviews 159: 35–46).

Fig.1. Comparison of pollen-based reconstructions for both PANN and TANN with 17 Chinese numerical historical records from the Han to Qing Dynasty: (a) the detrended and 15-point smoothed pollen-based precipitation anomaly (mm), (b) the detrended and 15-point smoothed pollen-based temperature anomaly (°C), (c) economic level, (d) grain yield grade, (e) grain price index, (f) fiscal grade, (g) agriculturalist policy territory, (h) extreme flood years, (i) extreme drought years, (j) freeze disaster frequency, (k) sand-dust event frequency, (l) famine index, (m) locust frequency, (n) epidemic disaster frequency, (o) peasant uprising frequency, (p) number of wars, (q) number of southward nomadic migrations, (r) farming-pastoral boundary, and (s) number of estimated human population. 5D & 10K represents the period of Five Dynasties and Ten Kingdoms in China. The three gray bands indicate the time intervals of Medieval Climate Anomaly (MCA), Little Ice Age (LIA), and Current Warm Period (CWP), respectively. (Image by Li, et al.)

Fig.2. Percentage of variation (%) in 17 numerical Chinese historical indexes accounted for independently by PANN or TANN and their joint effects. RDA triplot indicates the correlations of the 17 numerical historical indexes with PANN and TANN. The Chinese historical dataset consists of economic level (EL), grain yield grade (GY), grain price index (GPI), fiscal grade (FG), agriculturalist policy territory (AT), extreme flood years (EF), extreme drought years (ED), freeze disaster frequency (FD), sand-dust event frequency (SD), famine index (FI), locust frequency (LF), epidemic disaster frequency (EPD), peasant uprising frequency (PUF), number of wars (NW), number of southward nomadic migrations (SNW), farming-pastoral boundary (FPB), and number of estimated human population (HP). (Image by Li, et al.)
Contact: LI Jianyong, State Key Laboratory of Loess and Quaternary Geology, Institute of Earth Environment, Chinese Academy of Sciences, Xi'an 710075, China. Email: lijy@ieecas.cn
 © 2015 Institute of Earth Environment,CAS
 Address:No. 97 Yanxiang Road, Xi'an 710061, Shaanxi, China

 Location :