Frequent occurrences of droughts in southwest China in recent years have raised increasing concerns among public and scientific communities. Meteorologists had done a lot of work to study the causes of the droughts. However, these analyses were based on short-term observations for the past 60 years and mainly focused on synoptic scale drought events. Was the recent decadal drought unprecedented? What’s the driving force of the decadal-scale precipitation variations in southwest China? Will the reduced precipitation trend continue in the future? Answers to these questions are crucial for water and resource management in southwest China.
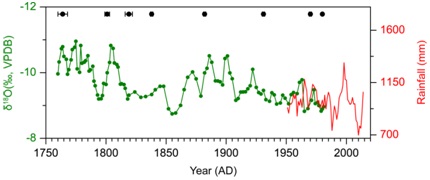
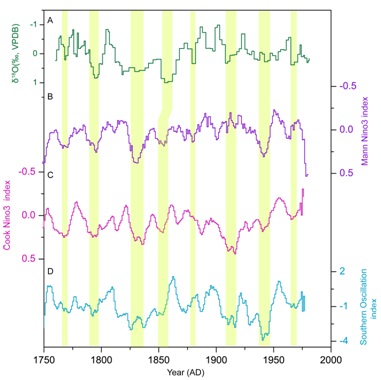
Dr. TAN Liangcheng, from Institute of Earth Environment, Chinese Academy of Sciences, together with his colleagues reconstructed monsoon precipitation variations in southwest China since 1760 AD by using an absolutely-dated stalagmite from Yunnan Province. By combining the speleothem δ18O and observed rainfall records, they found an overall decreasing trend in monsoon precipitation in this region and revealed the recent drought in 2009-2012 AD had been the driest since 1760 AD. Further studies suggested the long-term warming of tropical ocean might have caused the decrease of the land-sea thermal gradient and the amount of moisture transported from the Bay of Bengal, reducing precipitations in southwest China. El Nińo-like conditions of tropical Pacific sea surface temperature (SST) may cause decadal-scale droughts in this region. Considering the future El Nińo-like conditions in tropical Pacific under global warming scenarios, they also warned possible declining in precipitation and/or drought events in southwest China in the future.
This study was recently published on line in Climate Dynamics (Tan, Liangcheng et al. Decreasing monsoon precipitation in southwest China during the last 240 years associated with the warming of tropical ocean. Climate Dynamics, 2016, DOI: 10.1007/s00382-016-3171-y)

Fig. 1. XBL41 δ18O record during 1760-1981 AD (solid circle) and its comparison with annual precipitation (red line, 3-point moving average) record from Kunming meteorological station. (Image by Tan et al.)

Fig. 2. Comparisons of (A) detrended XBL41 δ18O record with (B) Nino3 index record (10-point moving smooth, Mann Nino3 index) reconstructed by Mann et al. (2000), (C) Nino3 index record (10-point moving smooth, Cook Nino3 index) reconstructed by D'Arrigo et al. (2005), and (D) Southern Oscillation index series (10-point moving smooth, Stahle et al. 1998). The shaded yellow bars indicate drought events in southwest China and their correlation with various series. (Image by Tan et al.)
Contact: TAN Liangcheng, tanlch@ieecas.cn, State Key Laboratory of Loess and Quaternary Geology, Institute of Earth Environment, Chinese Academy of Sciences, Xi’an 710061, China
 © 2015 Institute of Earth Environment,CAS
 Address:No. 97 Yanxiang Road, Xi'an 710061, Shaanxi, China

 Location :